In a recent analysis provided by the crypto analyst Dark Defender, a compelling case has been made for the potential significant rise in the price of XRP. Through a detailed examination of the XRP/USD chart on a monthly time frame, as sourced from Binance, Dark Defender highlights a large bullish formation, which he describes as a “bull flag” across multiple longer-term time frames including monthly, three-month, and six-month charts.
XRP Price Gears Up For Explosive Move
The analysis shows a substantial initial upsurge in price marked by a green arrow, suggesting a strong bullish momentum that started around early 2017 and peaked later that year. The price action following this peak is what Dark Defender identifies as a bull flag pattern. This pattern is characterized by a period of consolidation following a sharp movement in price, resembling a flag on a pole.
The consolidation, traced with a red descending trend line and a blue ascending trend line, forms a converging pattern known as a triangle, which typically suggests that the period of consolidation is nearing an end as the lines converge. According to Dark Defender, this suggests a breakout is imminent.
Related Reading
“I have read some posts that XRP had a bull flag in the daily time frame, etc. If those are correction bull flags, this is a bull flag, too. But a bullish one. It is in the monthly, three-month, and six-month time frames. If you know a bull flag, you can enjoy your coffee today. Cheers,” he stated.
In his forecast, Dark Defender uses the flag pole and Fibonacci extension levels to predict future price points. After the expected breakout above the red resistance line, the first target is situated at the 161.80% Fibonacci level, which would bring XRP to approximately $1.88. A further ambitious target is set at the 261.80% Fibonacci level, priced at about $5.86.
The most optimistic target lies at the 361.80% Fibonacci level, forecasting the price to soar as high as approximately $18.23. Notably, Dark Defender’s blue line, analogous in length to the flagpole, shows that the XRP price could rise well above $18.
Different Analysis, Similar Price Targets
This analysis was further commented on by another renowned XRP community analyst, EGRAG CRYPTO, who brought attention to the fact that the flag portion of the pattern extends beyond half the length of the initial pole, a structural detail that might typically invalidate the bull flag designation.
Related Reading
“I’ve dabbled in this analysis before, but lately, I’ve become increasingly intrigued by the potential of a symmetrical triangle breakout. What caught my eye is that the Flag is extending beyond half the length of the Pole which invalidates the structure. Regardless of who’s right or wrong, hope to meet in the near future and being multimillionaires. Keep up the fantastic work,” Egrag noted.
Despite this technical caveat, EGRAG CRYPTO remains positive about the potential of a symmetrical triangle breakout. In a recent analysis of the weekly chart, EGRAG elaborated that XRP will at least explode towards $1.5 if price breaks out to the upside of the triangle. On a broader triangle pattern, EGRAG expects a move to $5.89.
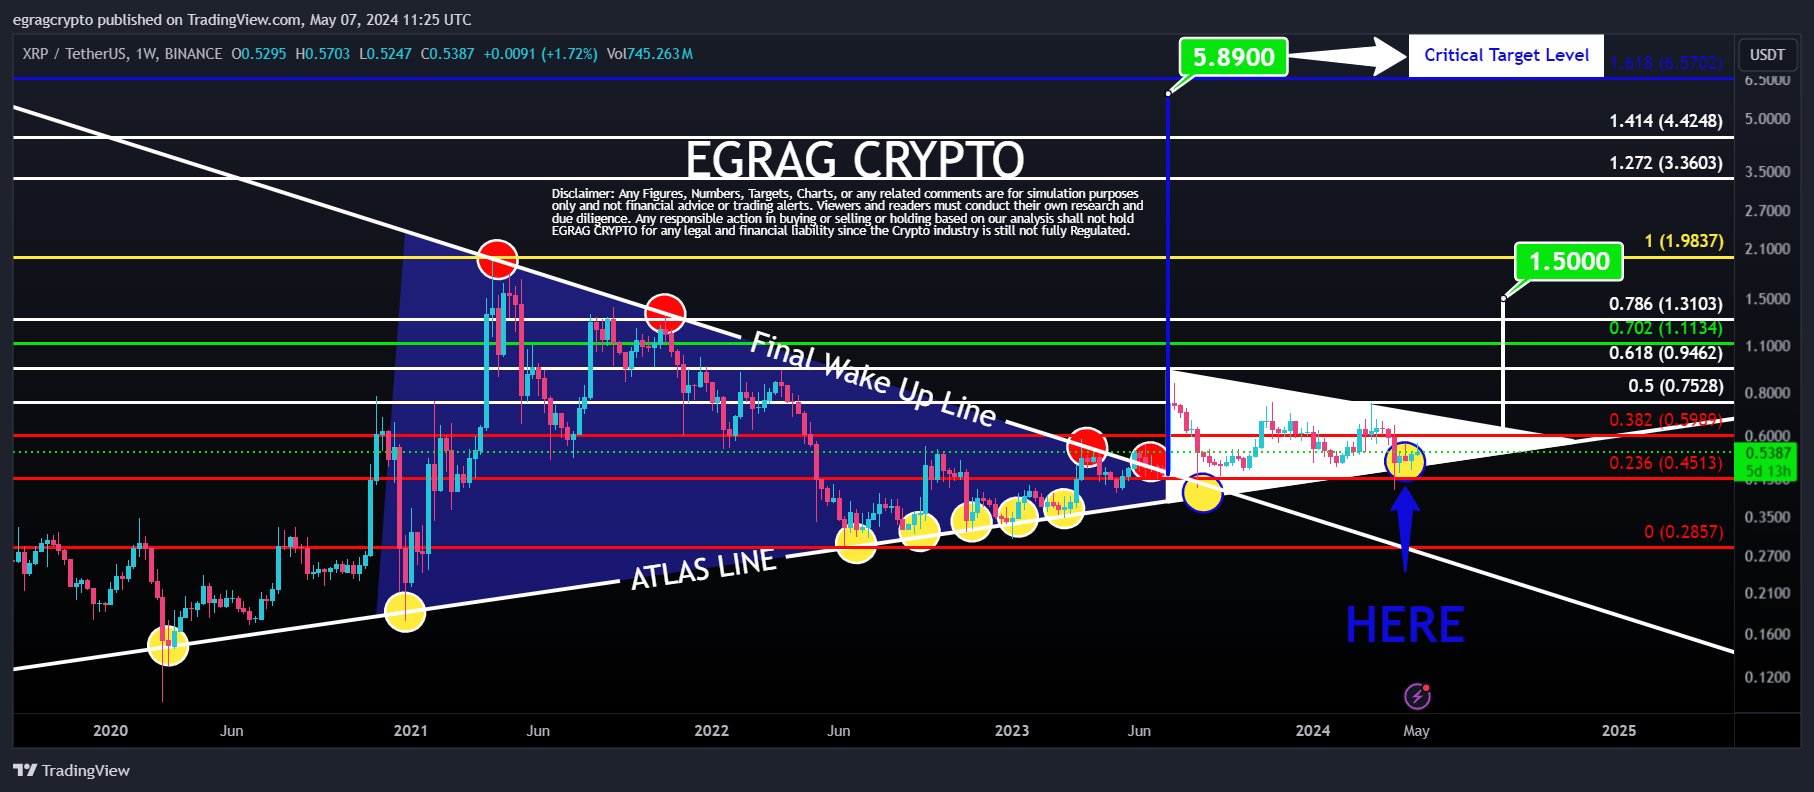
“XRP Army, STAY STEADY! There’s a mini pump to $1.5 and a major pump to $5.89 in the cards, with the MACRO pump potentially soaring above 2 digits,” he stated. Despite their different approaches, the two analysts are therefore very close in their analyses.
At press time, XRP traded at $0.5189.
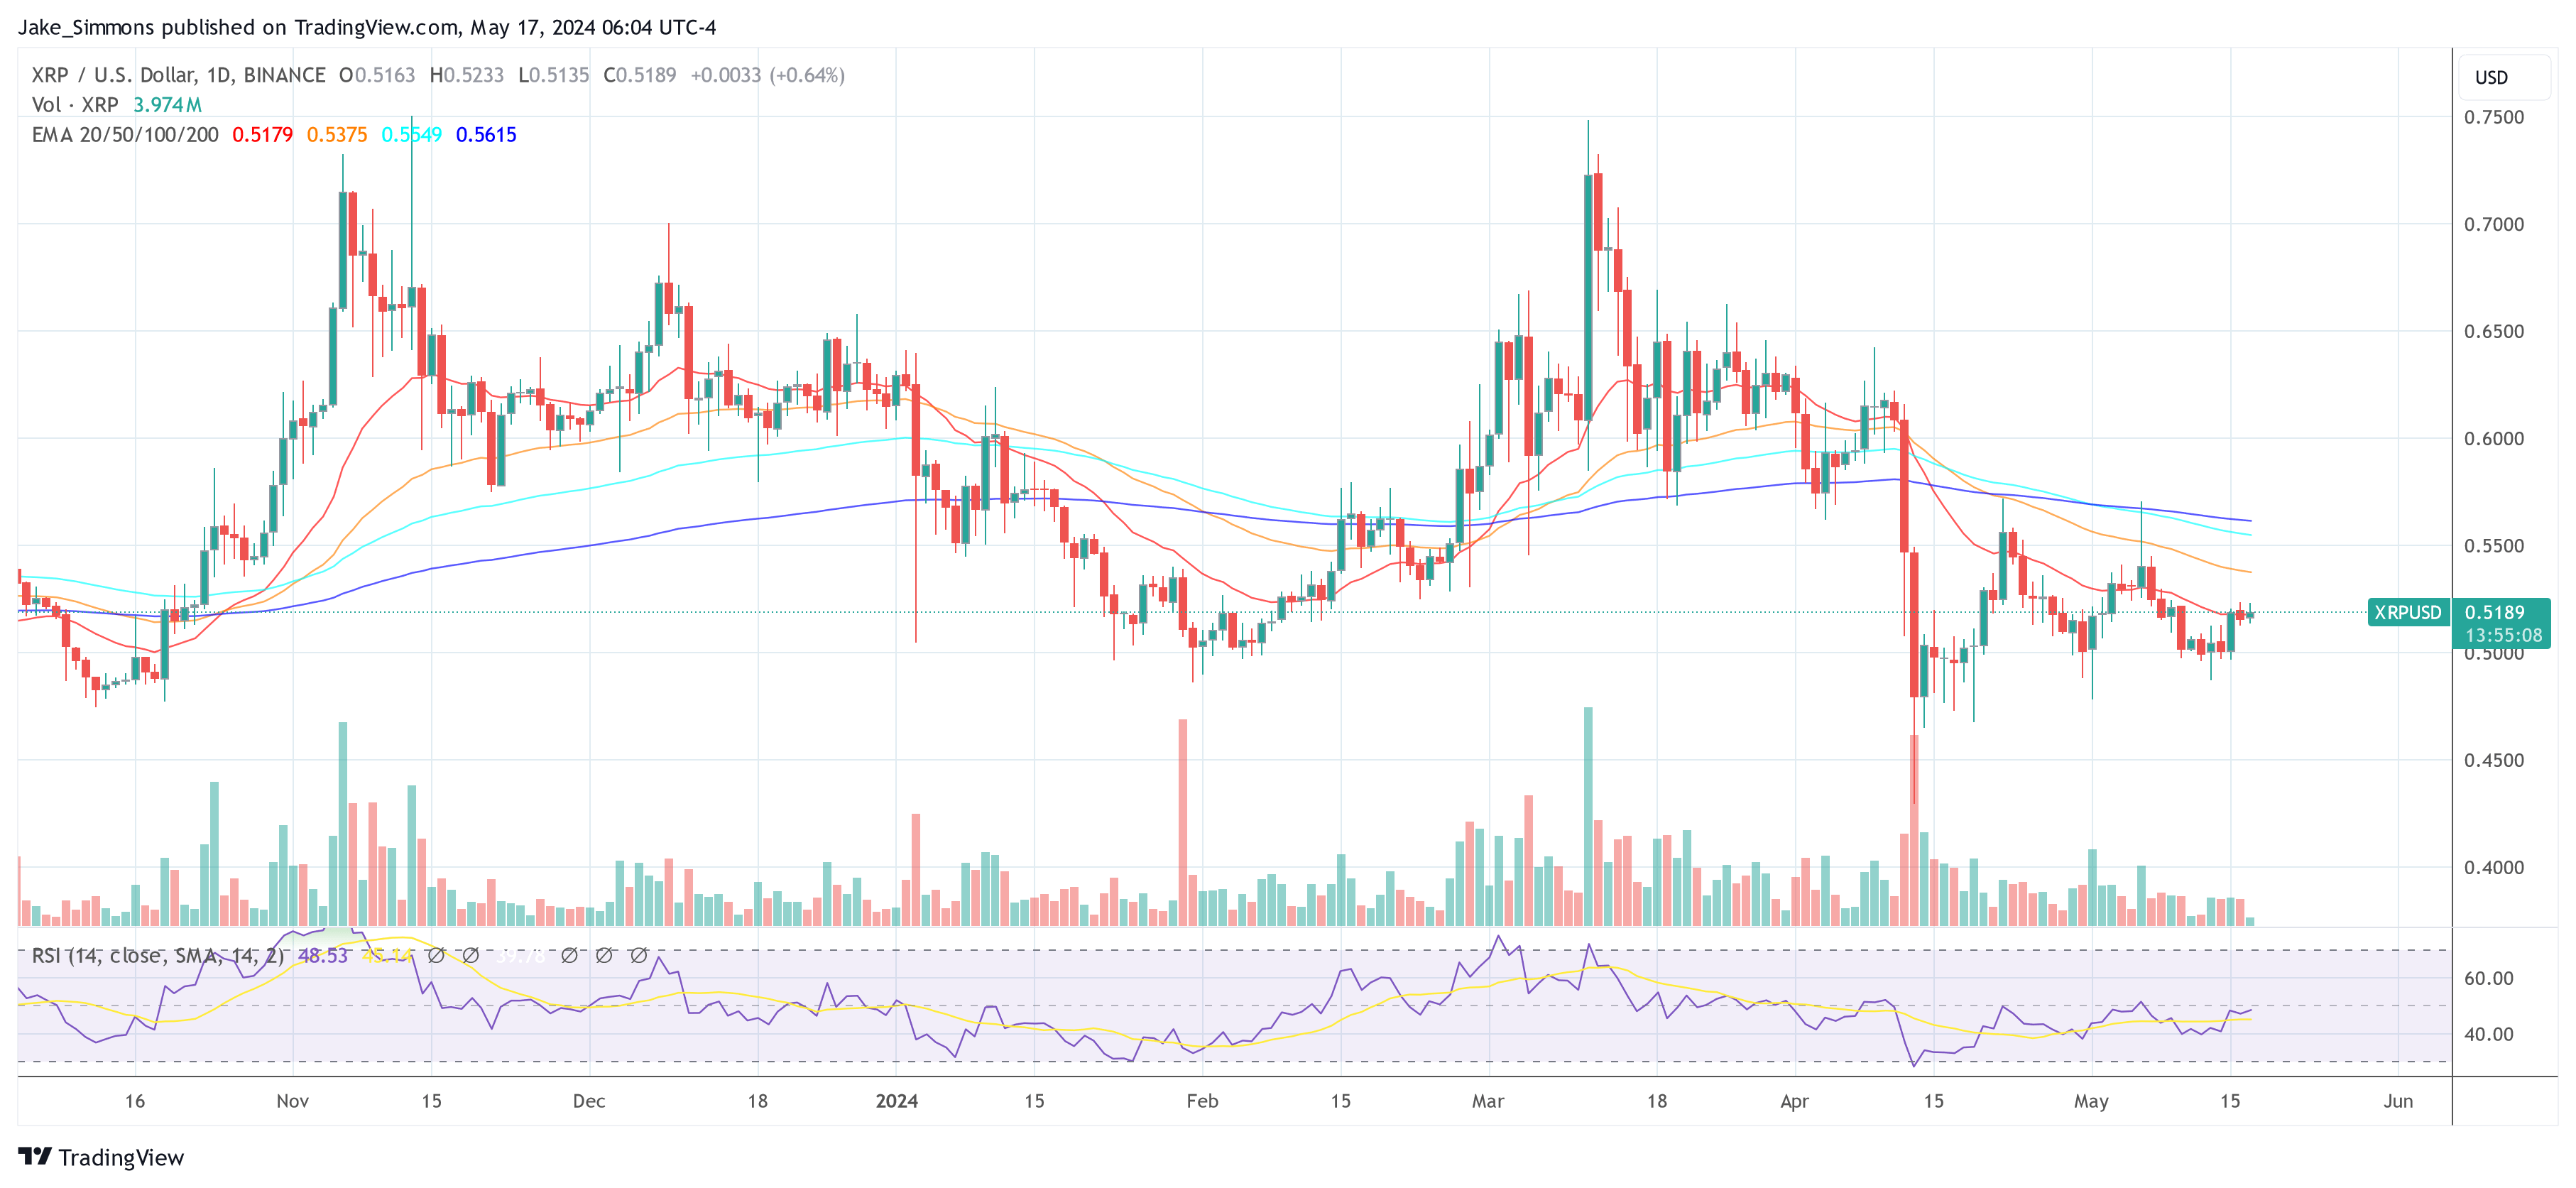
Featured image created with DALL·E, chart from TradingView.com
Credit: Source link


