- Solana dominated Ethereum in terms of network activity.
- SOL’s weekly chart remained green, but the trend might change soon.
Solana [SOL] has been gaining much traction in the recent past because of multiple memecoin launches on the blockchain. But there was more going on with the blockchain, as a key metric has been on an increasing trend, which looked pretty optimistic.
Solana is growing
AMBCrypto reported earlier how Solana’s volume was increasing, which can be attributed to multiple memecoin launches such as Dogewifhat [WIF], BONK, etc.
Additionally, the blockchain’s performance in the DeFi space was commendable. This was the case as Solana’s TVL recently reached an all-time high.
On top of that, Token Terminal recently posted a tweet that highlighted yet another achievement. As per the tweet, SOL’s fees have been on the rise.
In fact, if the latest data is to be considered, SOL’s fees were quite close to those of Ethereum [ETH]. AMBCrypto’s analysis of Artemis’ data revealed that a similar trend was also noted in terms of both blockchains’ revenue.
Source: Artemis
While Solana’s fees and revenue were closing in on those of Ethereum, SOL has already been dominating ETH by a substantial margin in terms of network activity.
Both Solana’s daily active addresses and daily transactions were considerably higher than Ethereum’s, reflecting SOL’s popularity and high adoption.
Nonetheless, Ethereum continued to lead in the DeFi space, as its TVL was much higher than SOL’s.

Source: Artemis
SOL bulls are not letting go
Amidst all this, SOL bulls rejected the decision to step down as the token’s weekly price action remained positive in the somewhat bearish market.
According to CoinMarketCap, at the time of writing, the token was trading at $167.45 with a market capitalization of over $76.9 billion.
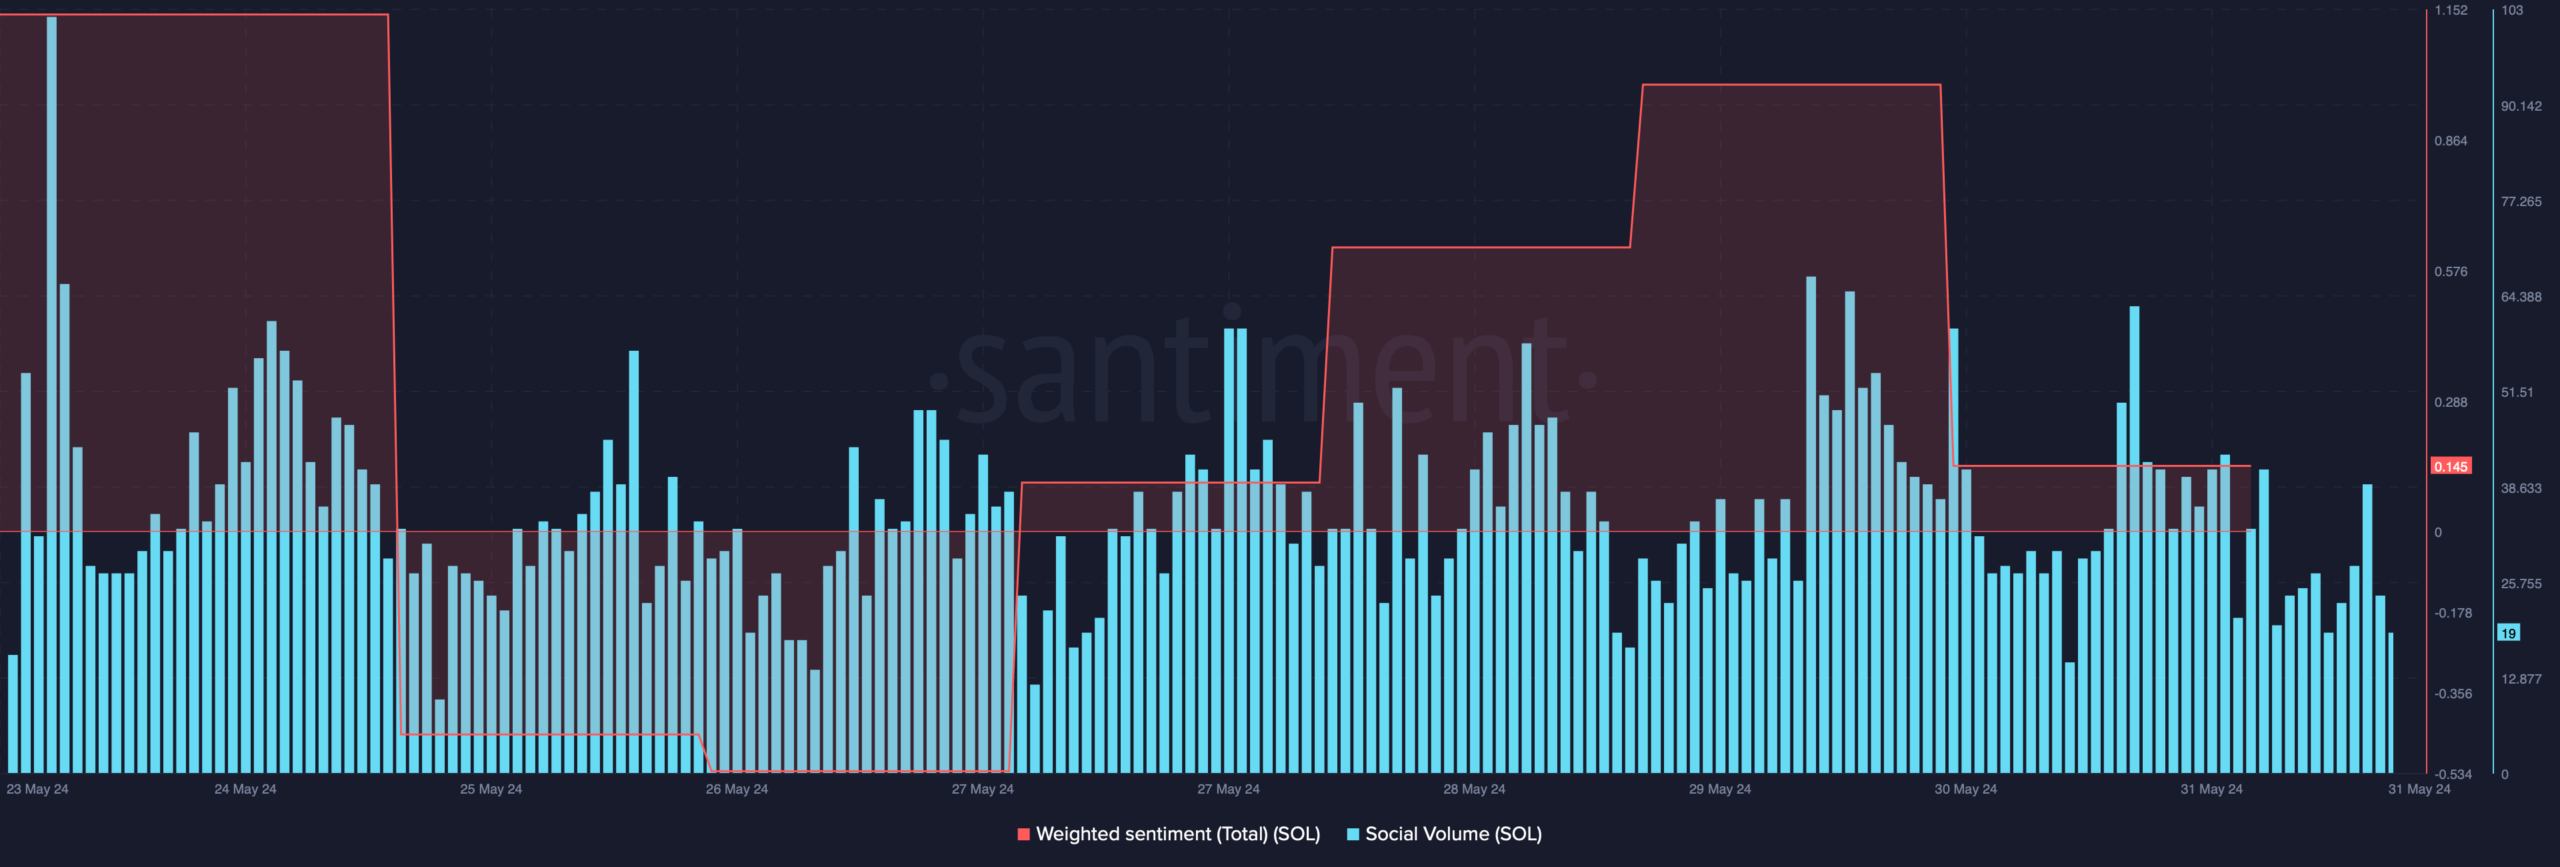
Thanks to the bullish price action, Solana’s weighted sentiment remained high. This meant that bullish sentiment around the token was dominant in the market.
Additionally, its social volume also remained high, reflecting its popularity in the crypto space.

Source: Santiment
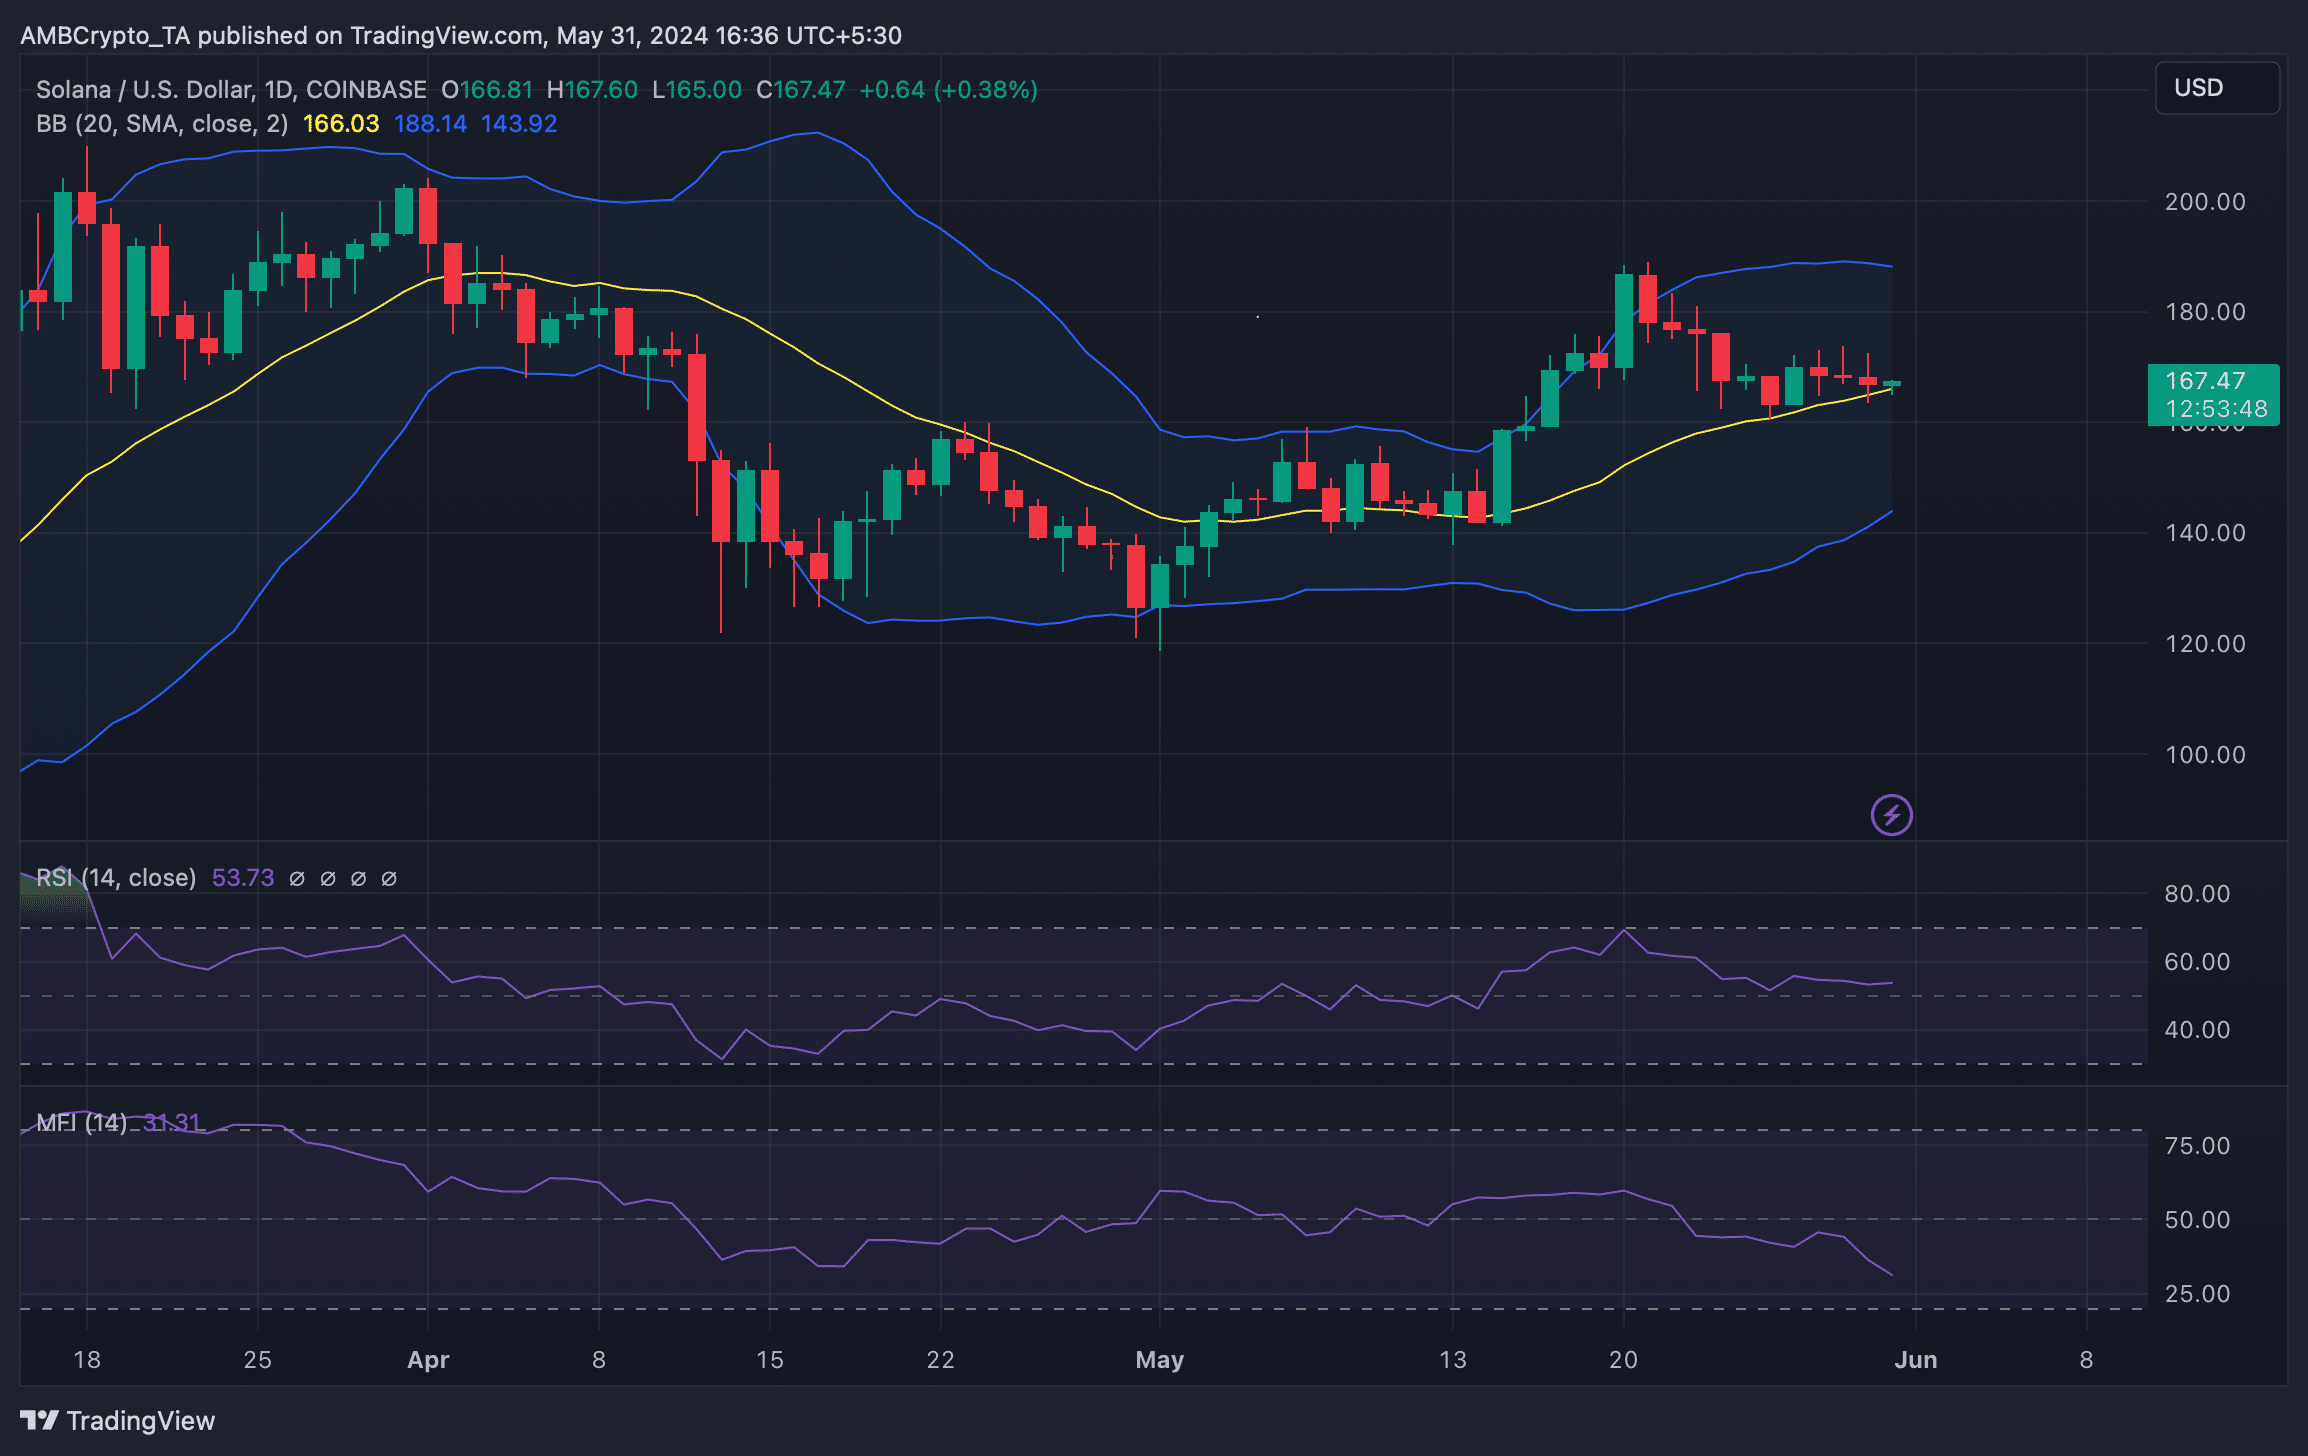
AMBCrypto then analyzed the token’s daily chart to better understand whether this bullish price action would continue further. As per our analysis, the positive price action might not last as its Relative Strength Index (RSI) took a sideways path.
Read Solana’s [SOL] Price Prediction 2024-25
Moreover, the token’s Money Flow Index (MFI) registered a sharp downtick, further hinting at a price drop.
Nonetheless, SOL was sitting right above its 20-day Simple Moving Average (SMA), which generally acts as a support.

Source: TradingView
Credit: Source link


